Stop guessing what is happening inside your environment
Xerixos helps teams monitor internal devices, spot meaningful issues sooner, and respond with clearer operational context than public-only monitoring can provide.
Real visibility, not just marketing language
The platform should show customers exactly what they gain: clearer health status, faster alert awareness, and better operational context across monitored environments.
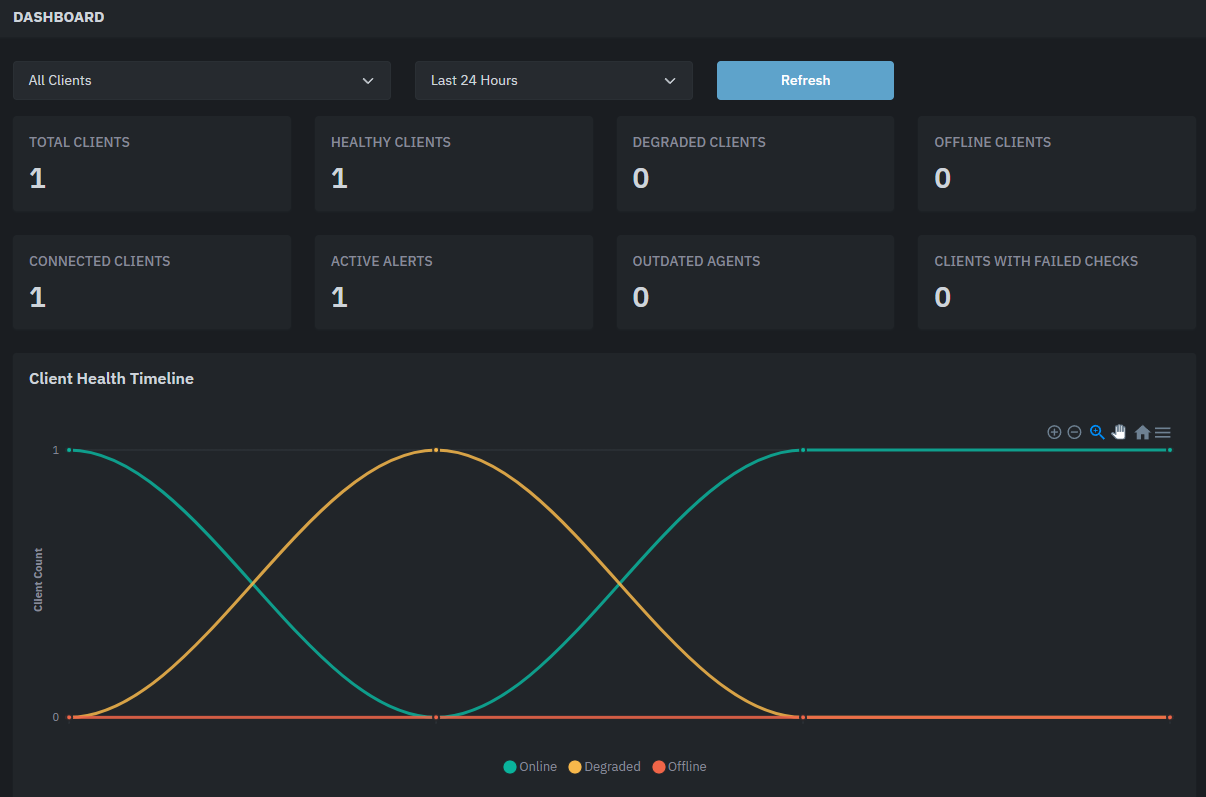
See environment health in one centralized view
Track client status, identify degraded conditions, and understand the current operational picture without relying on scattered tools or external-only checks. This is the kind of visibility that helps teams respond earlier and with more confidence.
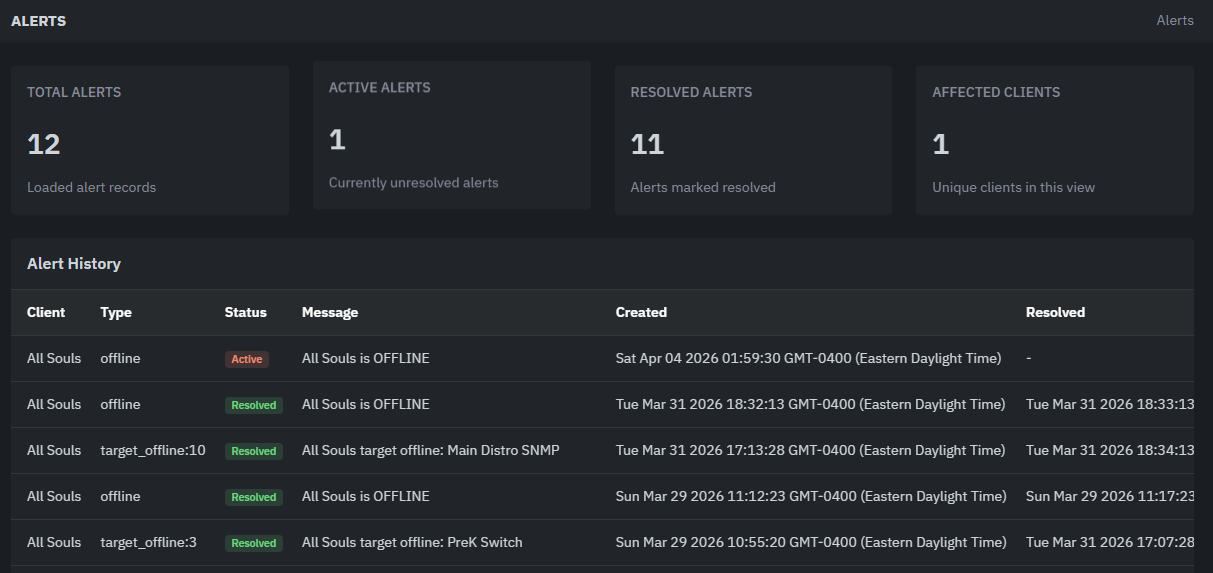
Review alerts with the context needed to act
See active and resolved alerts, affected environments, and alert history in one place. This makes it easier to understand what happened, what is still unresolved, and where teams need to focus next.
Most monitoring tells you too little, too late
Public uptime checks do not explain what is happening across internal devices, site conditions, or distributed environments. Xerixos is built to close that gap.
External-only monitoring misses internal problems
A site can look fine from the outside while internal targets are failing, degraded, or unreachable.
Delayed awareness slows response
When teams do not see issues early, troubleshooting starts later and downtime lasts longer.
Poor context creates operational friction
Teams need a clearer view of current conditions so they can act faster and with more confidence.
What makes Xerixos worth using
The platform is designed to give customers a cleaner operational picture and a more practical way to monitor real environments.
Internal visibility
Monitor internal IP targets and environment conditions that external-only tools often miss.
Faster awareness
Surface down and degraded conditions sooner so teams can begin troubleshooting earlier.
Clearer operational context
Give technicians and decision-makers a better view of what is happening right now.
Built around practical monitoring needs
A focused feature set that supports awareness, response, and scale without turning the page into a long product catalog.
Internal device monitoring
- Monitor internal IP targets
- Support multiple check types
- Gain visibility where external-only tools fall short
Practical alerting and visibility
- Surface down and degraded conditions
- Review recent health history
- Support faster troubleshooting workflows
Site-aware monitoring architecture
- Designed for multi-site visibility
- Useful for internal networks and branch locations
- Built for operational scalability
Who Xerixos is built for
Especially suited for environments that need practical infrastructure visibility, not just generic public status checks.
Multi-site organizations
Centralize visibility across campuses, branches, or distributed environments.
Internal IT teams
Gain better awareness into internal targets without unnecessary dashboard noise.
MSPs and service providers
Support cleaner monitoring workflows across multiple customer environments.
Create your free account and start monitoring right away
Start with a free account, explore the platform directly, and build visibility without a sales cycle.